The optimal way for a retailer to structure the categories in their store. We support Australian and New Zealand businesses with insights around price elasticity, strike rate, loyalty and more.
Product category analysis can help retailers boost revenue by building their understanding of their product range, categories and brands. This analytics method takes a fine-tooth comb to sales data, extracting valuable insights and actionable recommendations.
Product category analytics helps retail businesses optimise their product lines, pricing and promotions. Examining historical sales data and market trends can help marketing teams position products more effectively, sales teams understand their customers, and inventory teams get the right products on the right shelves.
Category analytics can help retailers find out more about their products, brands and product categories.
For example:
PRICING - Get the best price points for specific products or categories, as well as insight into how discounts and specials will impact sales.
DEMAND - Find the factors that influence demand for a product line or category, along with shifts in the market that change demand.
CUSTOMER LOYALTY - Are customers loyal to a particular brand, or are they happy to choose different brands based on price or availability?
PRODUCT RANGE - Optimise a product range, whether that means more product variations or focusing on a smaller subset of popular products.
INVENTORY - Avoid over or understocking to maximise sales and minimise waste.
SUPPLY MARKET - Scope out the supply market for a category or product.
BRAND DIFFERENTIATION - Focus on the features and qualities that make particular brands unique.
MARKET POSITIONING - Position a category or product for optimal growth and profitability.
Product category analysis, like any data analytics solution, involves assessing data sources, setting goals, running an analysis, and then putting findings into practice.
Here’s what the process looks like:
Data cleaning ensures that your analysis is based on accurate, high-quality data. At Datamine, the cleaning process involves integrating data from different sources, validating and reformatting as needed, and removing duplicates and errors. The goal is to have a clean, reliable source of data so you can trust the outcome of your analytics project. Getting great results often means working together to agree how exceptions should be corrected, to fit with business logic and the outcomes of the project.
Defining key objectives for your analysis project is crucial. This stage involves talking through your business goals and the insights you hope to uncover through a category analytics project and then using analytics methods to support those aims.
Analysis objectives include:
STRIKE RATE - Strike rate refers to the percentage of store or website visits that end in a sale. This can be a useful way to compare the performance of different stores or measure the impact of a price change.
PRICE ELASTICITY - Price elasticity compares demand for a product with price. If demand changes significantly when the price drops, this means demand is elastic. If demand is relatively stable despite shifts in price, it’s known as inelastic demand.
BASKET ANALYSIS - A basket analysis makes connections between products or brands that are often bought together. It looks at historical transaction data to find patterns and commonalities. The findings can be used to make product range changes, decisions around promotional offers, or better inventory decisions.
TIME-BOUND ANALYSES - Time-bound analyses examine sales and other metrics over a set period. They can help you identify patterns associated with particular seasons or times. For example, a time-bound analysis over the Christmas period could help you identify popular seasonal products and sales trends.
LOYALTY AND SUBSTITUTABILITY - Loyalty and substitutability look at how attached customers are to particular brands or products, and whether they will choose a similar product if their preferred item is unavailable. It helps you understand what’s driving customer decisions, which can help you optimise your product range and pricing. For example, if a product has high substitutability, your inventory team may decide to stock similar products to minimise the chance of a lost sale. On the other hand, if customers are very loyal to a specific product or brand, it could impact your negotiations with suppliers and your inventory choices.
At the end of the analytics phase, your organisation will have a series of recommendations on your product categories, brands, pricing and promotional strategies. These can be a resource for your marketing, inventory and sales teams, helping inform future campaign planning, stock decisions and promotional efforts. It’s about understanding your customers, their decision drivers and how they relate to your products.
The benefits of category analytics include optimising your product range, avoiding over and understocking, and deepening your understanding of customers, ultimately helping you stay ahead of competitors.
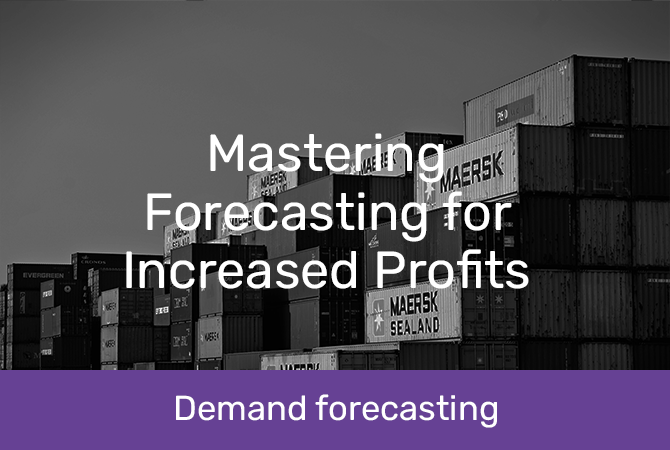
Category analytics helps you understand which products drive people to your stores, which are purchased together, which can be substituted and which can’t. This feeds into your supply chain and stock decisions, helping you optimise your product range to fit your customers.
If you know the products and volumes likely to sell in a particular period, you can make sure you have the right product on hand at the right time, avoiding expensive overstocking and wasted product. It also helps you avoid understocking, which can lead to lost sales and unhappy customers.
The more you know about customer behaviour, the more targeted, precise and personalised your service can be. For example, insights from basket analytics can help you make targeted recommendations for products that are often bought together. Understanding buyer behaviour is also invaluable when you’re developing a sales strategy, refining the layout of your stores, and setting product prices.
Boost customer satisfaction
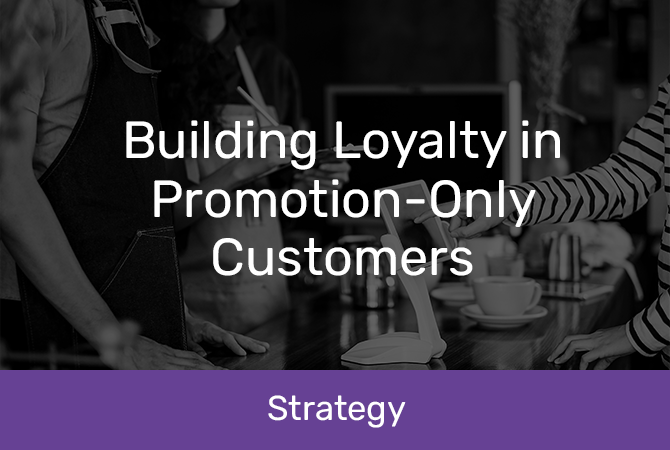
Customers who can buy their preferred products, get personalised service, and regularly receive discounts are more likely to be satisfied with your organisation. Category analytics can help you do all these things and give your customer satisfaction and loyalty levels a boost.
Want to know more about the products, purchases and people you’re serving? Talk to the team at Datamine now.
Datamine delivers category analytics solutions for businesses in a wide range of industries across New Zealand and Australia.
Industries include:
When a major New Zealand retailer wanted to optimise its pricing strategy, it turned to Datamine for help. Its project goals were to increase revenue for a particular department, optimise promotions to drive sales, and make sure its pricing was at the right level. The solution? An extensive price sensitivity and market positioning analysis.
The process
Datamine used the retailer’s historical data, along with banking data analysis, to examine the price elasticity of various products. We ranked products by price elasticity, factoring in price reductions, sales by volume and seasonal differences in demand and availability.
Our team also analysed the retailer’s current market share compared to independent, niche businesses in the same category.
The result
The result of the price sensitivity analysis was a list of products where price drove sales volume, along with insights into product pricing and seasonal variations. The retailer now uses this information in campaign development, pricing and supplier negotiation. The market share analysis serves as a benchmark – when the retailer implements a new pricing strategy or runs a new campaign, it can measure the impact on its overall performance.
Category analytics is a pathway to product optimisation – a way to match your product ranges to your customers, keep the right product in stock, and ultimately boost revenue. With support from the team at Datamine, your organisation can turn past sales data into actionable insights and tangible change.
Ready to start your optimisation journey? Fill in the contact form and one of our team members will be in touch.
Stay in the loop with our latest updates by signing up for our newsletter today!