

Was it really a good sales day?
wHY YOU NEED A BASELINE TO TELL THE DIFFERENCE
It’s your weekly sales meeting, and the numbers out of your stores are looking great.
Marketing points to its recent campaign.
Ops thinks it’s probably to do with its display reshuffle.
The buyers know it’s their incredible new season range.
You’re scratching your head and wondering, “Was it even a great sales week?” It’s up from the last quarter, but Christmas is coming up, and you’ve just opened a new store.
Factor in all the variables and that ‘good’ week might start to look pretty lacklustre. On the other hand, maybe the last ‘bad’ one was a massive win, considering all the factors working against you.
The point is that you don’t know. Sales figures only tell a small part of the story – what you need is a baseline.
What is a baseline?
So many internal and external factors influence retail sales that pure numbers aren’t an accurate measure of success. Offers and discounts, sales and promotions, new stores and new product lines, weather, holidays and events, the economy, inflation – these can all impact the number of people coming through your doors (digital or otherwise) and the amount they’re prepared to spend.
Think about the January flash-flooding in Sydney. If a retailer looked at sales in that week compared to the same week last January without considering the flooding’s impact, figures would look dire. This serves as a good reminder to consider all the possible factors impacting your business at a given time.
A baseline helps you work out how you should be performing, taking a multitude of factors into account, so you can tell whether a day or week really was ‘good’ or ‘bad’.
Without a baseline, you can’t be sure how well you’re doing.
And if you don’t know you’re having a bad week, how can you possibly do better?
 The Good day / bad day framework
Datamine’s Good Day/Bad Day framework is about establishing a baseline and helping you put your performance in context. It’s a tool that lets you set expectations, examine outcomes and find out what’s driving – or denting – your sales numbers.
Here’s how it works:
Gather your data
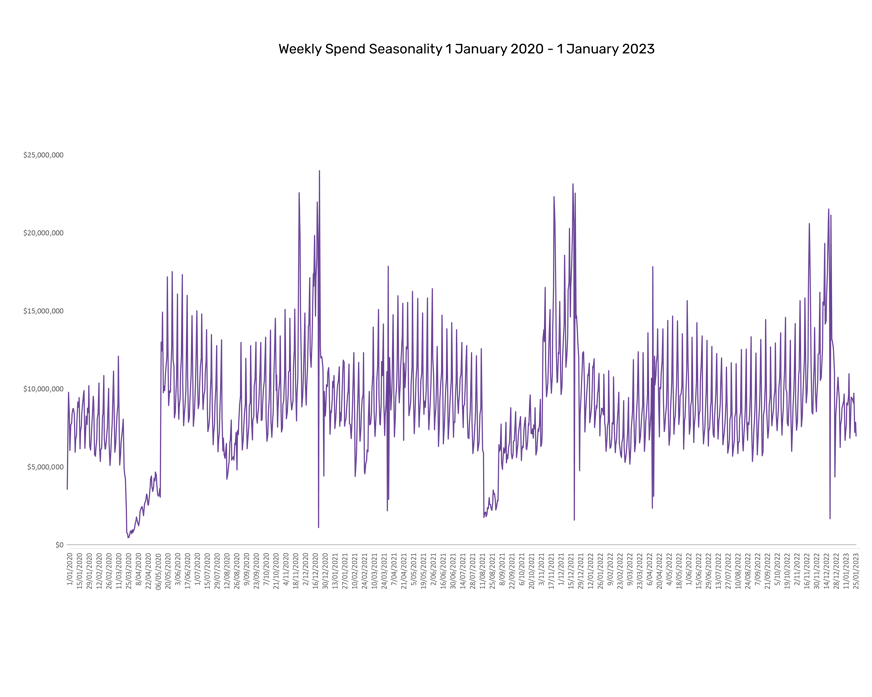
We start by pulling out two years’ worth of daily sales data (it will look a bit like the example below). This shows us the sales pattern across time – not just the extreme highs and lows, but broad waves over months and seasons.
Mapping the variables
Next, we bring in variables and map them against your data. We see the impact of seasons, holidays, weather patterns and behavioural trends. The data we pull in at this stage comes from third-party and public sources and depends on your location or locations – for example, stores in different areas will be impacted by different weather, events or roadwork issues.
Sometimes, this means tracking and modelling thousands of variables across different locations.
Seasonality
Seasonality reflects the natural ebb and flow of sales across weeks, months and years. Map across a single week, and you’ll often see a spending spike over the weekend.
Seasonality graphs (a three month snapshot of our data seen below) show sales patterns over time and express how much more revenue you can expect to bring in on, say, a weekend, on top of the underlying sales trends.
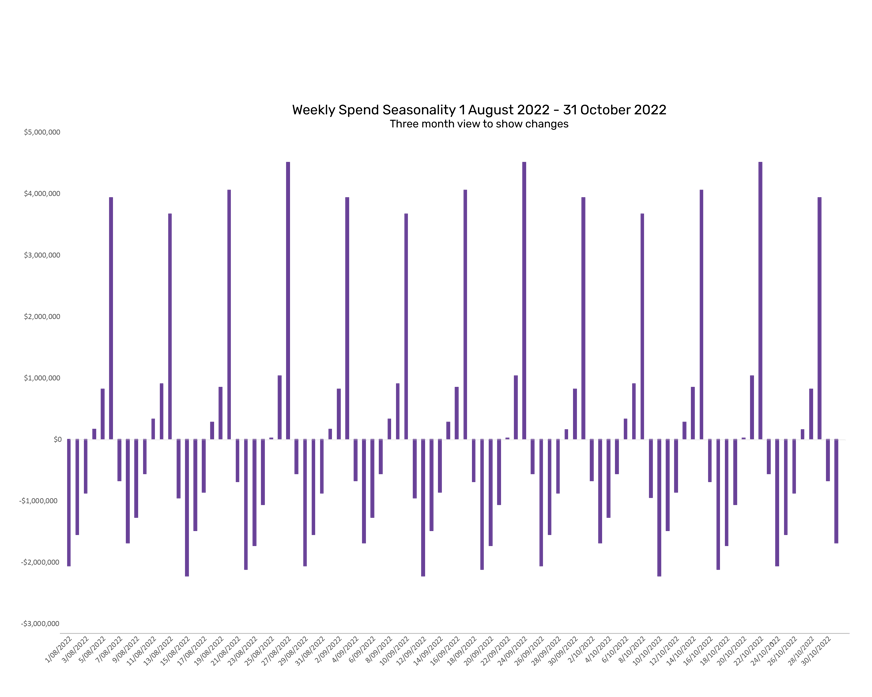
A scenario:
Sales are trending upwards at a rate of $1m per month. Seasonal trends put average sales at +$250K on a Saturday and -$100K on Wednesdays. In the first month of sales, this would mean you could expect to bring in roughly $1.25m on Saturdays and $0.9m on Wednesdays. The following month, you would expect $2.25m on Saturday and $1.9m on Wednesday.
External Events
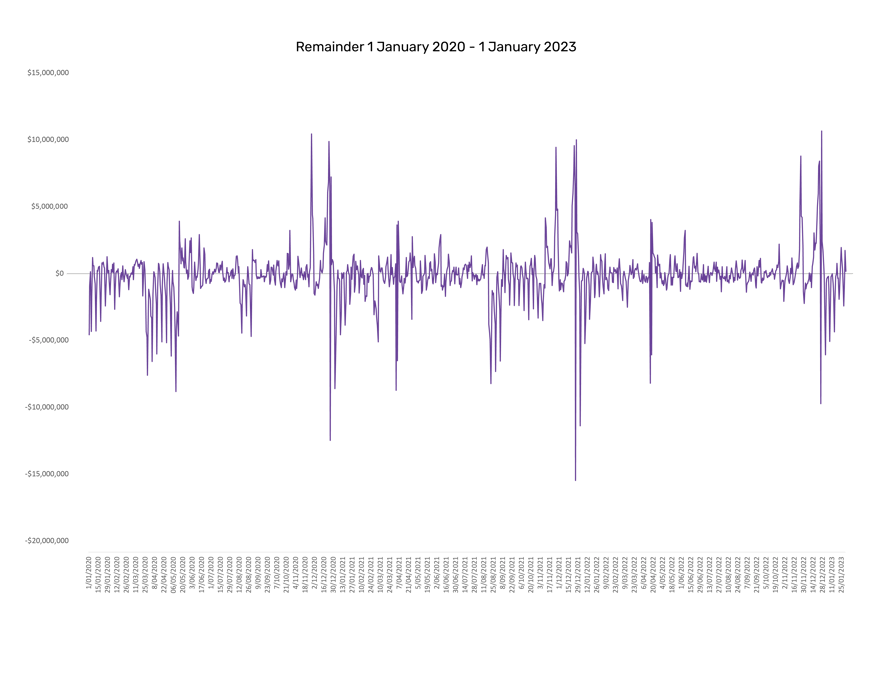
Holidays like Christmas and Mother’s Day and broad sales events like Black Friday also impact sales. When we look at historical data, we can see the impact of these events playing out in sales numbers – the graph below shows the lead-up to Christmas, which includes Black Friday.
Internal Events
Of course, outside events aren’t the only things that influence your business. Internal factors, like marketing campaigns, operational changes, product launches and store openings, can also affect sales. So, they must be factored into your Good Day/Bad Day framework.
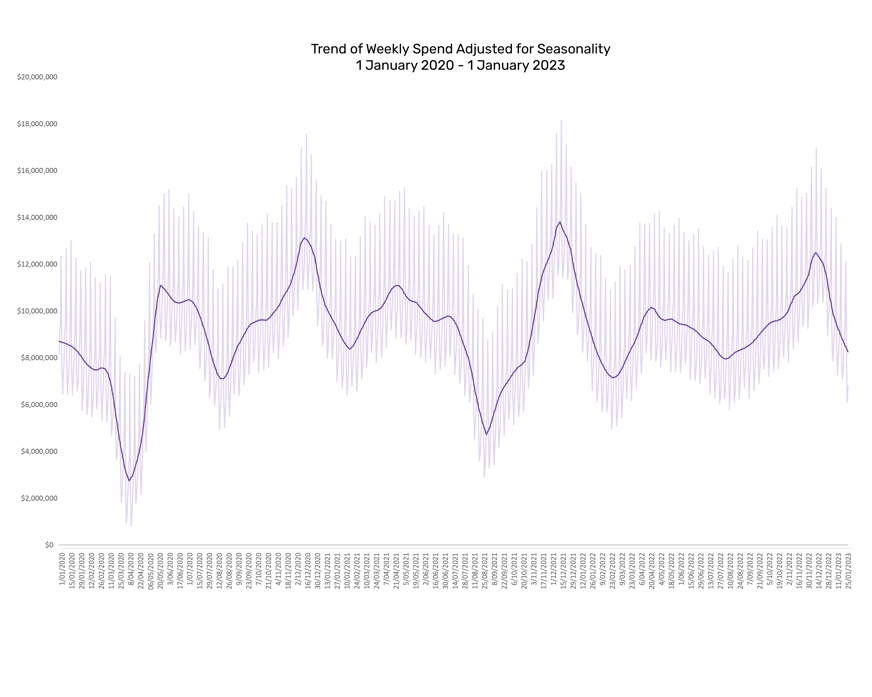
Adjust to baseline
With seasonality and major events factored in, we can adjust your original sales data and produce a baseline for your sales numbers. This lets you accurately forecast for the coming year, which also helps you plan for things like staff numbers and stock levels.
 Using your good day / bad day insights
How does looking at historical data help you move forward? A strong performance baseline is a crucial analytics tool that helps contextualise sales figures and pinpoint drivers of success or failure. Because you know what to expect, it’s easier to get clarity around results – without clouding your view with natural fluctuations or factors outside your control.
Here’s how our clients use the framework:
High-level campaign tracking
There are plenty of ways to measure the reach of a marketing campaign – likes, views, CTR, conversions – but how do you know whether a campaign is increasing sales? The baseline comes in here, giving you an accurate sales estimate to compare against real-world numbers.
Tracking daily or weekly sales figures through a real-time dashboard? The framework provides a clear line in the sand, so it’s easier to see spikes and slumps as they happen. Are sales perking up a week after the launch of a new campaign, or is it just the continuation of a long-term upward trend? Is a minor drop in sales numbers the result of a campaign failure, or just the post-Christmas slump?
Post-campaign analytics
If your business runs multiple campaigns throughout the year, rather than focusing on one or two large events, the Good Day/Bad Day framework can help tease out the impact of different campaigns and strategies. By looking at past sales figures alongside previous marketing campaigns and promotions – plus the other variables in the framework – we can identify which campaigns work.
For example, email campaigns might generate an average of 3% increase in sales, while social media campaigning only delivers roughly 0.5%. This information will help you refine your marketing efforts and focus ad spend in the right places.
Exception reporting
Exception reporting is about understanding the drivers of outlier days or weeks.
Promotions can be complex – and it can be difficult to tell whether they are delivering the results you want. This is particularly true when you run a limited-time promotion or a special tied to a particular day. You may see a clear bump in sales during the promotion, but you don’t really know where these sales are coming from. In some cases, your promotion could be bringing in brand new customers or increasing the average spend of your existing audience. In others, what looks like a jump could reflect sales shifting from one week or day to another – without impacting your overall revenue for the period.
This is where the GD/BD framework is invaluable. Because it breaks down expected sales over time, it’s possible to see the difference between a profitability shift and a true increase in sales.
A good day / bad day example case
Here’s one example of exception-tracking in action. A client, let’s call it PetrolCo, was running a weekly deal called ‘Discount Days’, which involved a discounted petrol price on (you guessed it) Fridays. While sales were clearly up on Fridays, some execs suspected the promotion was eating into sales from other days of the week. They felt that existing customers were waiting until Friday to fill their tanks.
Using the Good Day/Bad day framework, we compared expected sales figures to the actual numbers across the week. The outcome: the promotion was proven to be a success – other days were continuing to meet expectations, while Friday sales were tracking above expectations.
As a result, PetrolCo could rest easy about those shifting sales numbers and continue to use ‘Fill-er Up Friday’ as a promotional technique.
Market share modelling
Market share can help you zoom out even further, giving you more valuable context for your revenue figures. By overlaying Good Day/Bad Day data with market share information, you can gather insights about your performance compared to the competition. Sales might be tracking down, but if your market share is rising, it’s a sign that your business is doing something right. While you could still be concerned about an overall drop in sales for your sector, you can focus on that issue instead of your competition.
 Know better, do better
The Good Day/Bad Day framework isn’t exactly straightforward – but neither is running a retail business. While the framework involves too many graphs and too much analytical modelling for the average person, all that underlying complexity boils down to valuable insights and informed decision-making for your business.
By combining data from a wide range of sources and mapping your sales information against critical variables, we can give you an accurate baseline for expected sales figures over time. Using that baseline, we can analyse current sales numbers to measure the performance of campaigns and promos, look at your market share, and even weigh the impact of events outside your business.
All this information and insight add up to better-informed decision-making – not guesswork. Instead of a Monday morning meeting full of credit-claiming or finger-pointing, you get the data you need to assess performance – good or bad. And, while you can’t do much about weather patterns or cultural events, you can find out which internal levers will impact sales – for example, a product launch or promotional offer.
As always, the more you know, the better you can do.
Want to find your baseline? Talk to the team at Datamine to get started.
At Datamine, we work with clients across Australia and New Zealand in almost every sector – from retail and banking to not-for-profits.