Analytical Visualisation: ClientView

Analytical Visualisation: ClientView

Analytical Visualisation is a process to detect the underlying features and value in the data. Our 
ClientView tool enables you to look at many variables at a time and helps in in cutting through to gain deeper insights.

ANALYTICAL VISUALISATION: CLIENTVIEW

Analytical Visualisation (AV) is quickly becoming the go-to tool for identifying and looking at what’s happening within your data in relation to your business objectives. 

Analytical Visualisation (AV)

There are four steps in Analytical Visualisations:

1. Understanding the organisation objectives
2. Organise the data
3. Carrying out the analysis
4. Visualising and interpreting the results

ClientView is one tool we use to cut through the complexity of datapoint relationships, the volume of data and the endless reporting. 

It is a form of AV that enables you to streamline the complexity of your business and the data you have – so you can understand what is happening, make informed decisions, and measure the effect of your actions.

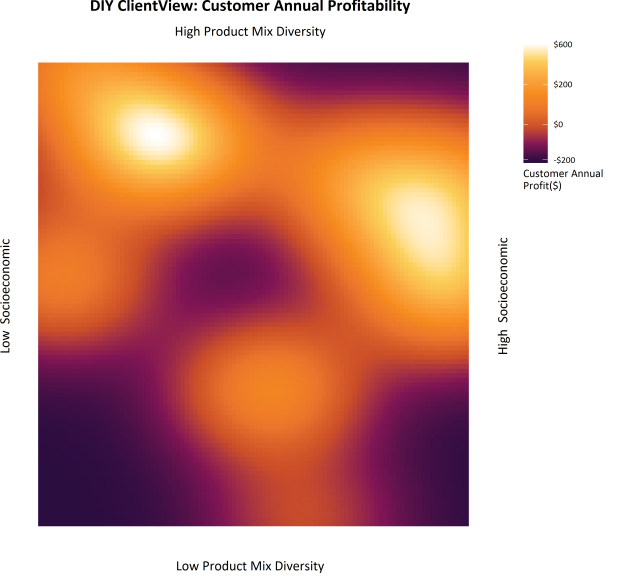
ClientView uses statistical, machine learning and mathematical methods to explore and identify features within the data and entities supplied.  Once identified, the visualisation enables the user to explore the analysis. 

You are looking at a complex combination of variables across your entire customer base, including demographic and behavioral interaction data.


BENEFITS & FEATURES

Benefits

  • Visually understand complex relationships within your disparate data
  • Identify changes that occur within your data over time
  • Ability to answer different sets of questions within your business with multiple ClientView visualisations
  • Statistical, machine learning and mathematical methods to explore and identify features within the data and entities supplied

Features

  • Highly visual and intuitive representation
  • Unlimited variables
  • Unlimited database entities
  • Advanced statistical, machine learning and mathematical techniques
  • End user ‘self-service’ model
  • Real time visualisations and time series movies available
  • API interface available for real-time updates
  • Integrates into dashboards, CRM and ERP’s
  • Database independent

BUSINESS FUNCTIONAL AREAS & INDUSTRIES COVERED

Business functional areas:

  • HR
  • Marketing and social media
  • Customer service and support
  • Sales
  • Accounting, audit, and finance
  • Production
  • Operations
  • Purchasing

Industries covered:

  • Retail
  • FMCG
  • Banking and finance
  • Telecommunications
  • Utilities
  • Travel and Tourism
  • Entertainment
  • Insurance
  • Healthcare
  • Not for profit
  • Government

WHAT NEXT?

A-score banner

Schedule a free phone chat with a Datamine consultant

Interested in learning more about ClientView or analytical visualisations?  Fill out the form below to schedule a call with us.